It’s 5:05 PM on a Friday. A notification pops up—a new demo request from a perfect-fit lead. The office is emptying out, and that lead will sit untouched until Monday morning. It feels like a minor delay, but what if you could measure the exact financial cost of those 60-plus hours of waiting?
It’s not cents or dollars. It’s thousands.
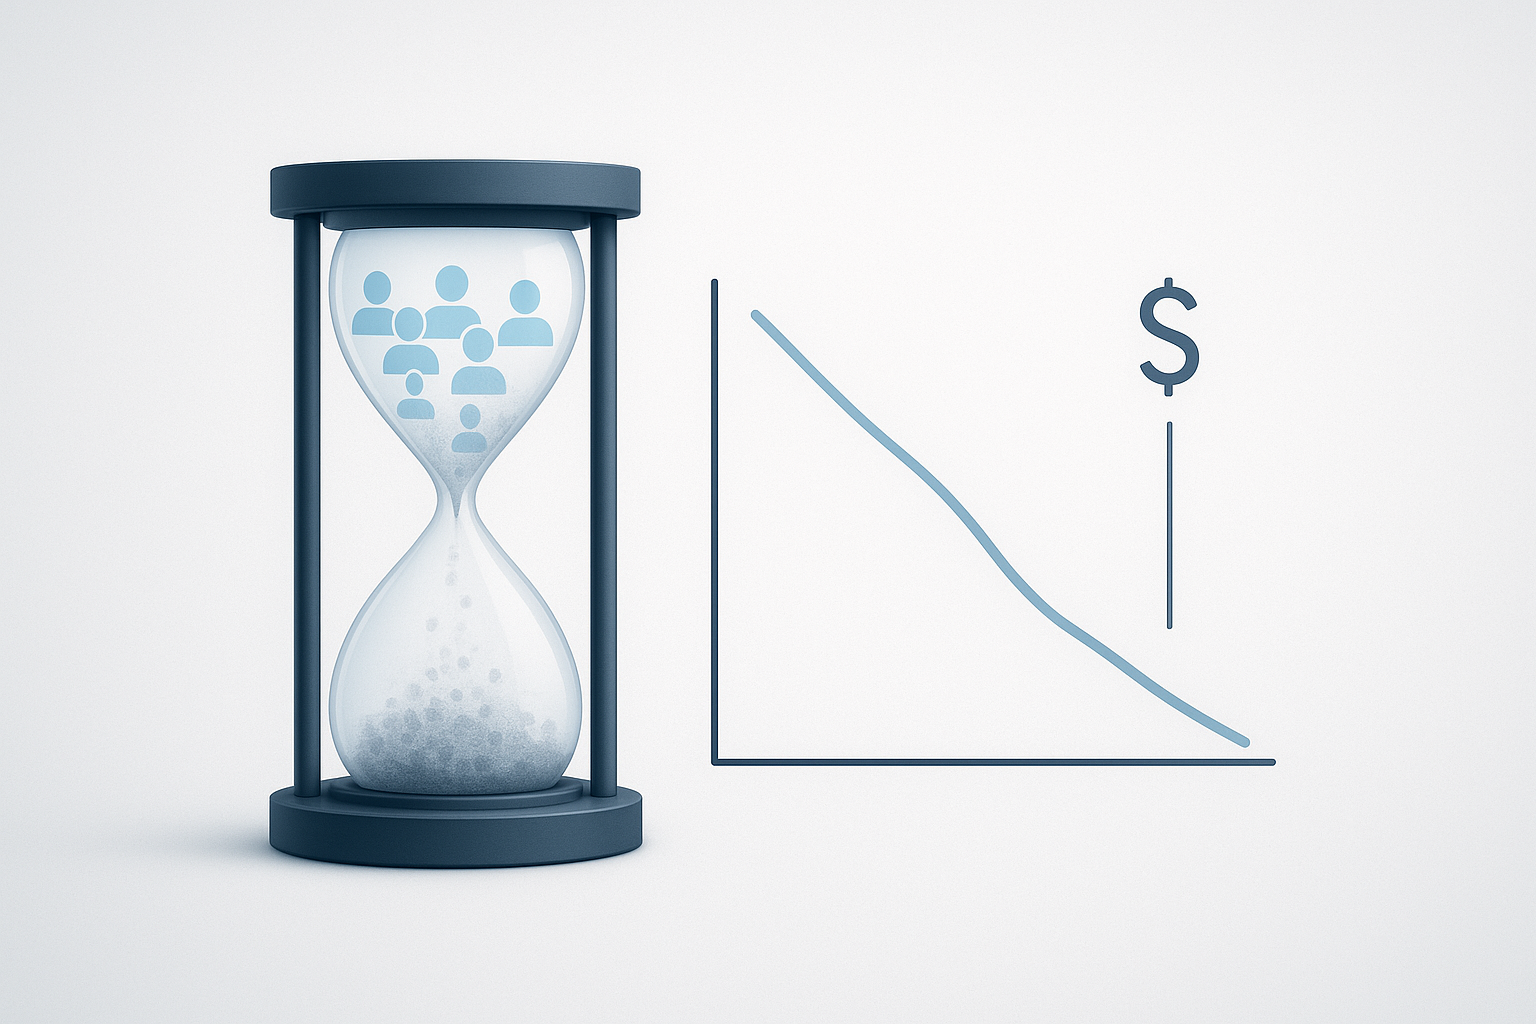
This is lead decay, the silent revenue leak happening in nearly every business. Most teams feel the problem when a hot lead goes cold, but they can’t prove the impact with data. They lack the numbers to justify investing in better processes or automation.
This guide changes that. We’re going to break down the Lead Decay Formula, a practical model that transforms the abstract concept of “speed to lead” into a concrete dollar amount. For operations leaders, this isn’t just an interesting metric—it’s the key to building an undeniable business case for change.
What is Lead Decay, Really? (And Why It’s Costing You More Than You Think)
Think of a lead’s interest like a burning match. The moment they fill out your form, the flame is at its brightest. Their pain point is top of mind, they’ve set aside time to research, and they are actively looking for a solution.
Every minute that passes, their focus shifts. A competitor calls them back first. An urgent work task pulls them away. The original problem that felt so pressing gets relegated to the bottom of their to-do list.
In today’s on-demand world, buyers expect immediate answers. Research from Ziff Davis reveals that for 74% of B2B buyers, response time is the number one factor when choosing a vendor. They aren’t just looking for the best product; they’re looking for the most responsive partner. When you’re slow, you’re not just late—you’re signaling that you’re not the right partner.
The Data Doesn’t Lie: The Astonishing Speed of Lead Decay
The drop-off in a lead’s viability isn’t a slow, gentle slope. It’s a cliff. The first few minutes are the most critical, and the data is staggering.
A landmark study from MIT found that waiting just 30 minutes to respond to a lead versus responding in 5 minutes results in a 21x decrease in your odds of qualifying them. The same lead, the same need, the same product—but a 25-minute delay vaporizes 95% of your opportunity.
This isn’t an isolated finding. The evidence is overwhelming:
- Vendasta reports that 78% of customers buy from the company that responds to their inquiry first.
- Lead Connect found that responding within the first 5 minutes makes you 9 times more likely to convert a lead.
- InsideSales.com research shows that 35-50% of all sales go to the vendor that responds first.
The message is clear: the race for revenue is won in minutes, not days. Delay isn’t just a bad customer experience; it’s a direct transfer of revenue to your faster competitors.
The Lead Decay Formula: Turning “Missed Opportunities” into Hard Numbers
Now, let’s turn this understanding into a tool you can use. The Lead Decay Formula helps you calculate the revenue lost due to delayed responses over a specific period.
It looks complex, but it’s built on simple inputs you likely already track. Let’s break down each component.
Step 1: Gather Your Ingredients (The Variables)
To calculate your lead decay cost, you need four key pieces of data:
- Average Order Value (AOV): What is the average total revenue you generate from a single new customer in their first year? If you have different product tiers, a blended average works well here.
- Baseline Conversion Rate (CVR): This is your lead-to-customer conversion rate under ideal conditions. For this formula, use the conversion rate for leads you respond to within 5 minutes. If you don’t track this, start with your overall conversion rate and aim to refine it later.
- Number of Leads (L): How many inbound leads do you receive in a given period (e.g., per month)?
- Conversion Rate Drop-Off (D(t)): This represents the percentage decrease in your conversion rate caused by your average response time (t). For example, if your average response time is 60 minutes and data shows this causes your conversion rate to drop by 85% compared to a 5-minute response, your D(t) is 0.85.
Step 2: Putting It All Together (A Practical Example)
Let’s see the formula in action with a hypothetical company, “SaaSWorks.”
- AOV: $10,000
- Baseline CVR (at <5 mins): 8% (0.08)
- Leads per Month (L): 300
- Average Response Time (t): 2 hours
- Conversion Rate Drop-Off (D(t)) at 2 hours: 90% (0.90)
First, let’s calculate the Maximum Potential Revenue—what SaaSWorks could be making if every lead was contacted within 5 minutes.
Maximum Potential Revenue = L CVR AOV
300 leads 0.08 CVR $10,000 AOV = $240,000 per month
Next, we calculate the Lost Revenue using the drop-off rate.
Lost Revenue = Maximum Potential Revenue * D(t)
$240,000 * 0.90 = $216,000 per month
SaaSWorks isn’t just missing a few deals; their two-hour average response time is costing them over $2.5 million in lost revenue annually. Armed with this single number, an operations leader can walk into any boardroom and instantly command attention.
Where Does the Delay Come From? Identifying the Hidden Bottlenecks
Calculating the cost is the first step. The next is understanding where the friction comes from. Delays aren’t usually caused by lazy reps; they’re caused by broken processes.
Common culprits include:
- Manual Triage: A manager or admin has to look at every lead and decide who it goes to. This is a guaranteed bottleneck.
- Inefficient lead routing: Leads are sent to the wrong person, to someone who is out of office, or are distributed unevenly, overwhelming some reps while others wait for work.
- Data Entry Delays: Reps have to manually copy-paste information from one system to another before they can even begin their outreach. The cost of this manual lead processing is measured in lost deals.
- Time Zone Gaps: A lead comes in from another region overnight and sits for hours until the local team starts their day.
- Tech Stack Latency: Slow syncing between your marketing automation platform and your CRM can add precious minutes or even hours to the delay.
Building Your Business Case: From Data to Action
The Lead Decay Formula is your most powerful tool for driving organizational change. Instead of saying, “We need to be faster,” you can say, “Improving our average response time from two hours to five minutes could unlock an additional $2.5 million in revenue this year.”
This reframes the conversation from a cost center (hiring more staff, buying new tools) to a profit center. It aligns Sales, Marketing, and Operations around a single, measurable goal. This is the foundation of a strong Revenue Operations strategy—using data to eliminate friction and maximize the entire revenue lifecycle.
The solution isn’t about telling your team to “work faster.” It’s about designing a system where speed is the default. This involves automating manual work, ensuring leads are routed intelligently and instantly, and providing reps with the data they need the moment a lead arrives.
Frequently Asked Questions (FAQ)
What if I don’t know my exact conversion rate drop-off?
Start with the industry benchmarks mentioned in this article. Assume a significant drop-off (e.g., 80-90%) for any response over 30 minutes. This provides a conservative starting point you can refine as you gather your own data.
Is this formula only for B2B companies?
Not at all. The principle applies to any high-intent lead, including B2C inquiries for considered purchases like mortgages, insurance, education, or automotive sales. If a customer is raising their hand, the clock is ticking.
What is a “good” lead response time?
The gold standard is under 5 minutes. This is the window where you maximize your chances of connecting with and qualifying an interested buyer.
Can we solve this just by hiring more people?
Adding headcount to a broken process only creates more expensive chaos. The most effective solution is to fix the underlying system first. Automation and intelligent routing create a scalable foundation that makes your entire team more productive.
Your Next Step: From Awareness to Assessment
You now have a framework for diagnosing one of the most significant and often invisible sources of revenue leakage in your business. Understanding the scale of the problem is the first step toward a solution.
We encourage you to take 30 minutes this week to gather the four variables for the Lead Decay Formula and run the numbers for your own organization. The result will likely be surprising, serving as the perfect catalyst for a much-needed conversation with your team and leadership. Don’t let another lead’s interest fade away—quantify the cost and start the journey to fixing it.