
The Franchise Reporting Dilemma: Why Your SEO Reports Are Failing Corporate and Franchisees
You’re on the quarterly review call with your multi-location franchise client. The corporate CMO is on screen, laser-focused on one thing: brand-level share of voice against the national competitor.
“I want to see how our overall search visibility has grown since Q2,” she says.
As you pull up the aggregate dashboard, a franchisee from Des Moines unmutes. “That’s great, but my phone isn’t ringing. Why is ‘Johnson’s Plumbing’ down the street outranking my location on Google Maps for ‘emergency plumber near me’?”
The tension is palpable. The CMO considers the franchisee’s question a distraction, while the franchisee sees the corporate data as irrelevant fluff. And you, the agency, are caught in the middle, trying to prove your value to two completely different audiences with conflicting priorities.
If this scenario feels familiar, you’re not alone. It’s the central paradox of franchise marketing: how do you serve the brand and the branch? The answer doesn’t lie in a better report; it lies in a better reporting strategy.
The Two-Headed Client: Understanding the Franchise SEO Paradox
Serving a franchise isn’t like serving a single business. You’re serving two clients in one: the corporate brand guardian and the individual franchisee, the local champion. Each has a unique definition of success, and a single, one-size-fits-all report will inevitably fail them both.
This is a high-stakes game. The franchise sector is a cornerstone of the economy, generating over $860 billion in economic output in the U.S. alone. Getting the reporting right means retaining and growing high-value accounts. Getting it wrong means a constant struggle to prove ROI.
The Corporate Brand Guardian Cares About:
-
Aggregate Growth: How is the brand’s overall digital footprint expanding?
-
Brand Consistency: Is our messaging and information uniform across all locations? Because inconsistent brand information can decrease consumer trust by up to 71%, this is a top priority.
-
Market Share: Are we gaining ground on our national competitors?
-
Overall ROI: Is the total investment in SEO driving measurable business growth across the system?
The Local Franchisee Cares About:
-
Local Visibility: Can customers find my specific location when they search? Since 47% of all Google searches have local intent, this is often the only thing that matters on the ground.
-
Foot Traffic & Phone Calls: Is my Google Business Profile driving real-world actions like calls, direction requests, and website visits?
-
Leads & Sales: Is my online presence generating tangible revenue for my business?
-
Local Competition: Am I beating the other local businesses in my service area? After all, 87% of consumers use Google to evaluate local businesses, so winning that moment is crucial.
Trying to cram these competing needs into one dashboard is like trying to have a single conversation about macroeconomics and a leaky faucet at the same time. Everyone leaves confused and unsatisfied.
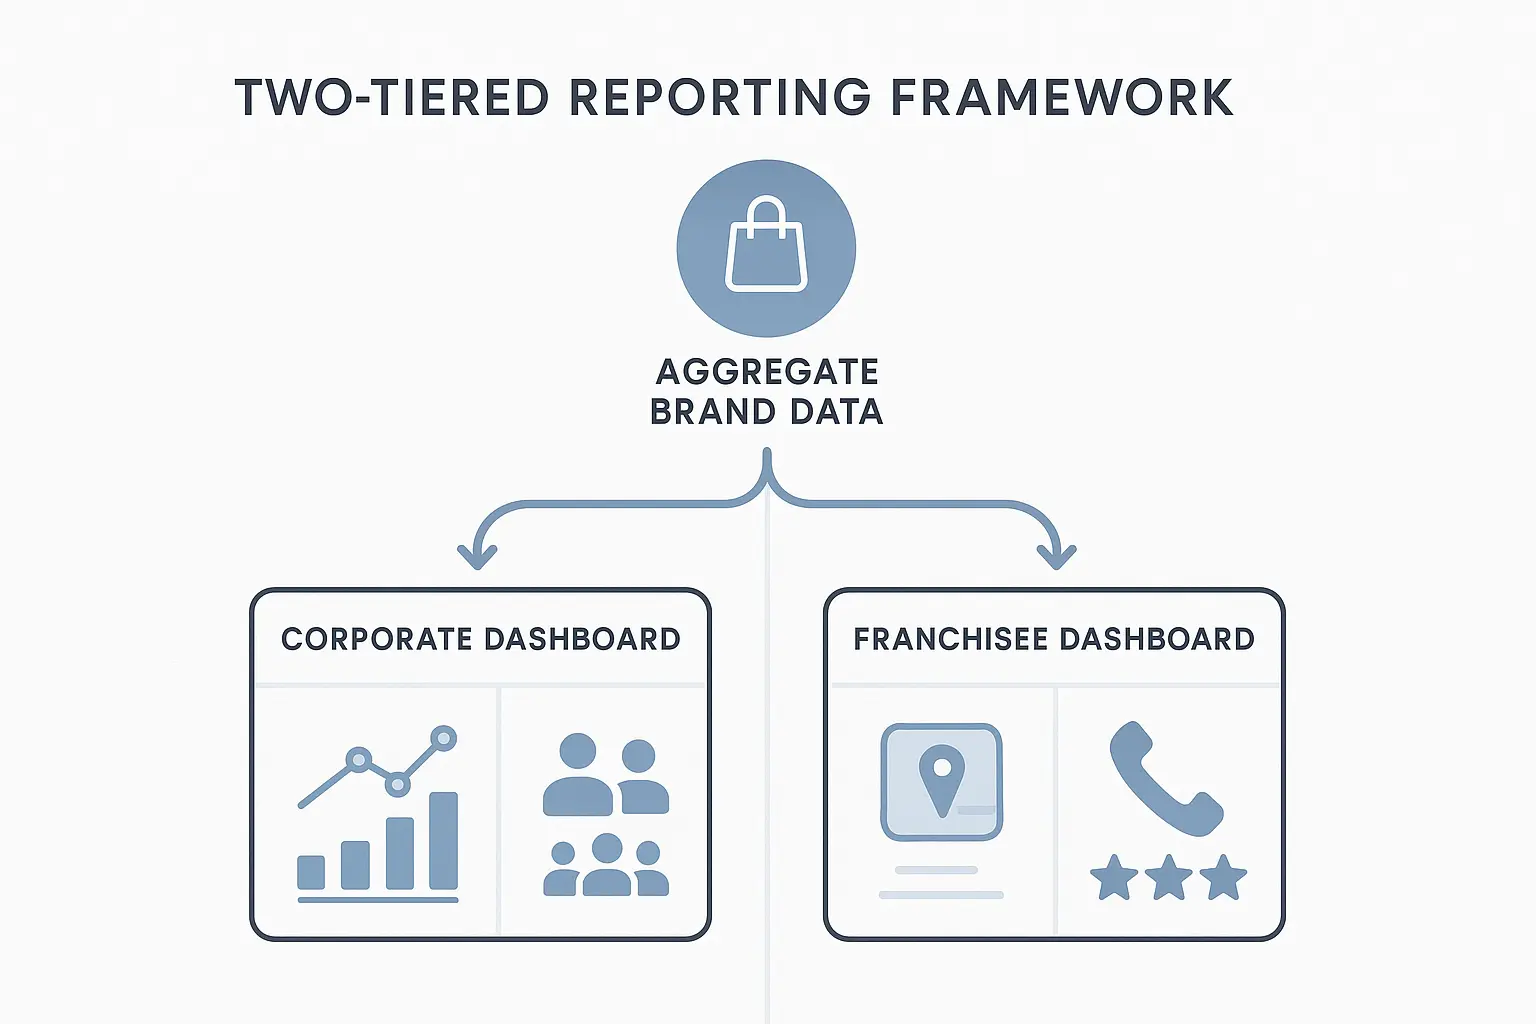
The Solution: A Two-Tiered Framework for Franchise SEO Reporting
The most effective way to communicate value to both stakeholders is to stop trying to make them share a report. Instead, create a connected, two-tiered reporting system that gives each party the exact information they need, in the language they understand.
-
Tier 1: The Corporate Aggregate Dashboard (The 30,000-Foot View)
-
Tier 2: The Individual Location Dashboard (The On-the-Ground View)
These two tiers aren’t separate; they inform each other. The success of dozens of individual locations is what creates the upward trend on the corporate dashboard, and this framework makes that connection clear.

Building the Individual Location Dashboard: What Franchisees Actually Care About
The franchisee’s dashboard has one purpose: to answer the question, “Is SEO helping my specific location make more money?” This report should be clean, simple, and focused on tangible, local outcomes. Remember, 75% of consumers are more likely to visit a business’s website if it’s in local search results, so connecting your work to website visits and calls is key.
Key Metrics to Include:
-
Local Rankings: Track a handful of high-intent keywords for their specific service area (e.g., “best pizza in downtown Des Moines”). Show their position in the local pack and traditional organic results.
-
Google Business Profile (GBP) Performance: This is the franchisee’s digital storefront. Highlight metrics like Clicks-to-Call, Website Clicks, Direction Requests, and Total GBP Impressions vs. a local competitor.
-
Local Leads & Conversions: Track form fills and calls originating from their specific location page.
-
Review Velocity & Average Rating: Showcase growth in reviews and overall sentiment, as this is a powerful local ranking factor and conversion driver.
This dashboard validates the franchisee’s investment and gives them clear, actionable data. It proves you understand their world.
Building the Corporate Aggregate Dashboard: Proving Brand-Level ROI
The corporate dashboard is for the CMO and brand managers. They need to see the big picture and understand how the SEO program is contributing to high-level business objectives. Here, you zoom out from individual locations to show collective progress.
Key Metrics to Include:
-
Aggregate Search Visibility: Show the brand’s overall visibility for broad, competitive keywords across all markets.
-
Total Leads & Conversions: Sum the leads from all locations to show the total pipeline generated by the SEO program.
-
Geographic Performance Analysis: Use a heat map to visualize which regions or cities are performing best, identifying opportunities for growth in underperforming areas.
-
Brand vs. Non-Brand Traffic Growth: Show you’re not just capturing existing brand demand, but also creating new interest by ranking for non-branded terms.
-
Competitor Share of Voice: Benchmark the brand’s visibility against its top 1-3 national competitors to show market penetration.
This dashboard gives corporate the strategic insights they need to justify budget, plan for the future, and trust you as a strategic partner. Efficiently creating these reports is crucial; using tools for automated SEO reporting can turn a logistical nightmare into a streamlined, profitable process.
Bringing It All Together: How Two Dashboards Create One Cohesive Story
With a two-tiered system, you are no longer caught in the middle. You become the strategic hub, translating on-the-ground performance into a compelling brand growth story.
When the franchisee in Des Moines asks why a competitor is outranking them, you can pull up their individual dashboard and say, “Good question. We see that too. Our plan for next month is to launch a targeted review generation campaign and build two new location-specific pages to close that gap.”
When the CMO asks for the big picture, you can show the aggregate dashboard and say, “Overall brand visibility is up 15% year-over-year, driven by strong performance in the Southeast. Our next major opportunity is to apply the lessons learned there to our Pacific Northwest locations.”
This approach transforms your agency from a simple vendor into an indispensable growth partner. Managing this level of detail requires robust systems, but it’s the only way to effectively scale your SEO services for multi-location clients. For agencies looking to implement this without building it all from scratch, a white-label SEO partner with expertise in franchise marketing can provide the right framework and execution.
Frequently Asked Questions (FAQ)
Q1: What tools are best for creating these types of dashboards?
A1: Tools like Google’s Looker Studio, AgencyAnalytics, or DashThis are excellent for pulling in data from multiple sources (like Google Analytics, Google Business Profile, and rank trackers) to create customized, shareable dashboards for both corporate and franchisee stakeholders.
Q2: How often should we send these reports?
A2: Monthly reporting is a standard and effective cadence. The key is consistency. Each report should be accompanied by a concise summary that explains what the data means, what actions were taken, and what the plan is for the upcoming month.
Q3: How do I handle an underperforming location without alarming corporate?
A3: The two-tiered system is perfect for this. The individual dashboard allows you to diagnose the problem at the local level and create a specific performance improvement plan with that franchisee. You can address the issue directly without it becoming a red flag on the aggregate corporate report.
Q4: Can one person on my team manage reporting for a 50-location franchise?
A4: Manually, this would be incredibly time-consuming and prone to error, which is why automation is essential. Templated dashboards that automatically populate with fresh data each month are the only way to manage multi-location reporting profitably and at scale.
From Conflicting Reports to a Unified Growth Strategy
Stop trying to find the perfect all-in-one report. It doesn’t exist.
By embracing a two-tiered reporting framework, you tailor the conversation to the audience, demonstrating your value in ways that matter most to them. You empower franchisees with actionable local data while giving corporate the strategic oversight they need. This transforms reporting from a dreaded monthly chore into your most powerful tool for retention, proving that your agency understands the complex world of franchise SEO and is the right partner to navigate it.