You’ve been there. You spend hours compiling a detailed, 30-page SEO report filled with keyword rankings, backlink profiles, and traffic graphs. You send it off, proud of the comprehensive data. The response? Crickets.
If this sounds familiar, you’re not alone. The problem isn’t your data; it’s your audience. While your day-to-day contact might appreciate the granular details, the C-suite operates on a different wavelength. Research shows executives spend an average of just two minutes scanning a report before moving on.
In those 120 seconds, they aren’t looking for keyword movements. They’re looking for the answer to one fundamental question: “Is this investment growing our business?”
This critical disconnect is why a staggering 55% of CMOs say they face significant pressure to prove marketing’s ROI, yet struggle to do so effectively. The solution isn’t more data—it’s better communication. It’s time to ditch the encyclopedic report and embrace the one-page executive dashboard.
The Great Disconnect: Why Your SEO Reports Are Being Ignored
The core issue is the difference between activity metrics and business outcomes. As an agency, you track activities like ranking improvements and traffic spikes because they’re leading indicators of success. But to an executive, they’re just noise.
A CEO’s top priority isn’t ranking #1 for a keyword; it’s revenue growth—a concern shared by 73% of chief executives. They think in terms of market share, pipeline, and competitive advantage. Your reporting needs to speak that language.
When you send a report focused on rankings, you’re asking a busy executive to do the hard work of translating your team’s activities into business results. Most don’t have the time or context to connect those dots.
That’s the realization for many agencies: The goal of an executive report isn’t to show what you did but to show what impact you made.
Speaking the Language of Leadership: Metrics That Matter to the C-Suite
To create a report that gets noticed, you need to understand the unique priorities of each stakeholder in the boardroom. While their goals are aligned, their focus differs.
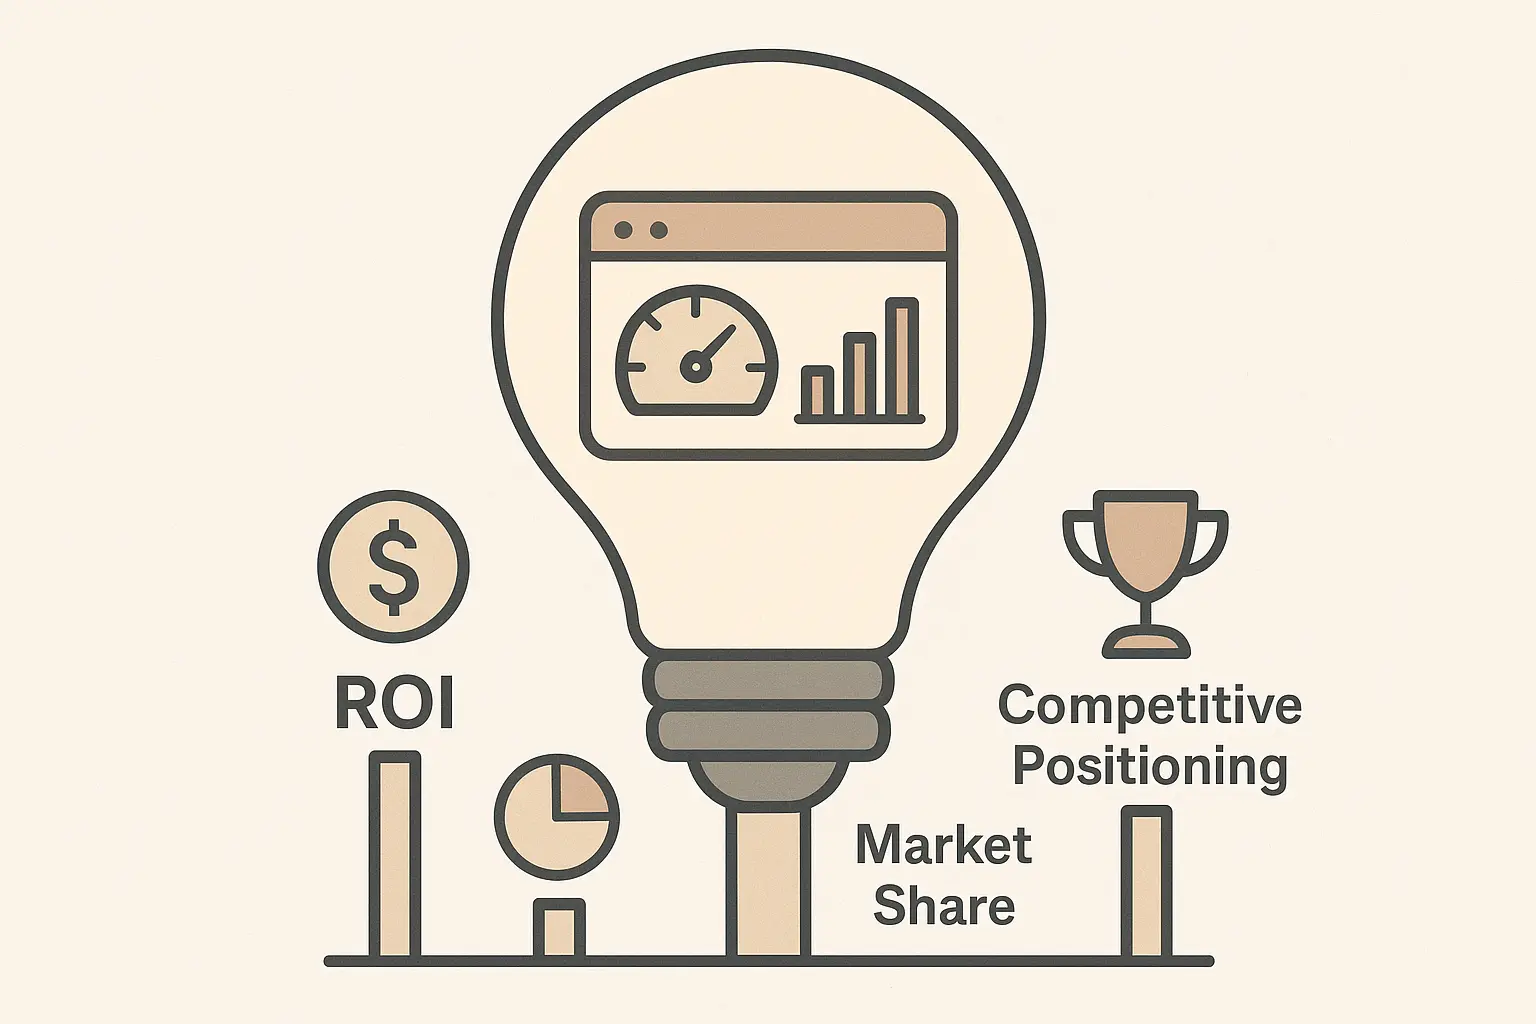
The CEO (Chief Executive Officer): Focused on top-line growth and competitive positioning.
Key Question: Are we capturing more market share?
The CFO (Chief Financial Officer): Concerned with efficiency and return on investment.
Key Question: Is this channel delivering a positive and predictable ROI?
The CMO (Chief Marketing Officer): Concentrates on market penetration and brand visibility.
Key Question: Is our brand’s digital presence growing stronger than our competitors’?
A truly effective one-page dashboard answers all three questions at a glance.
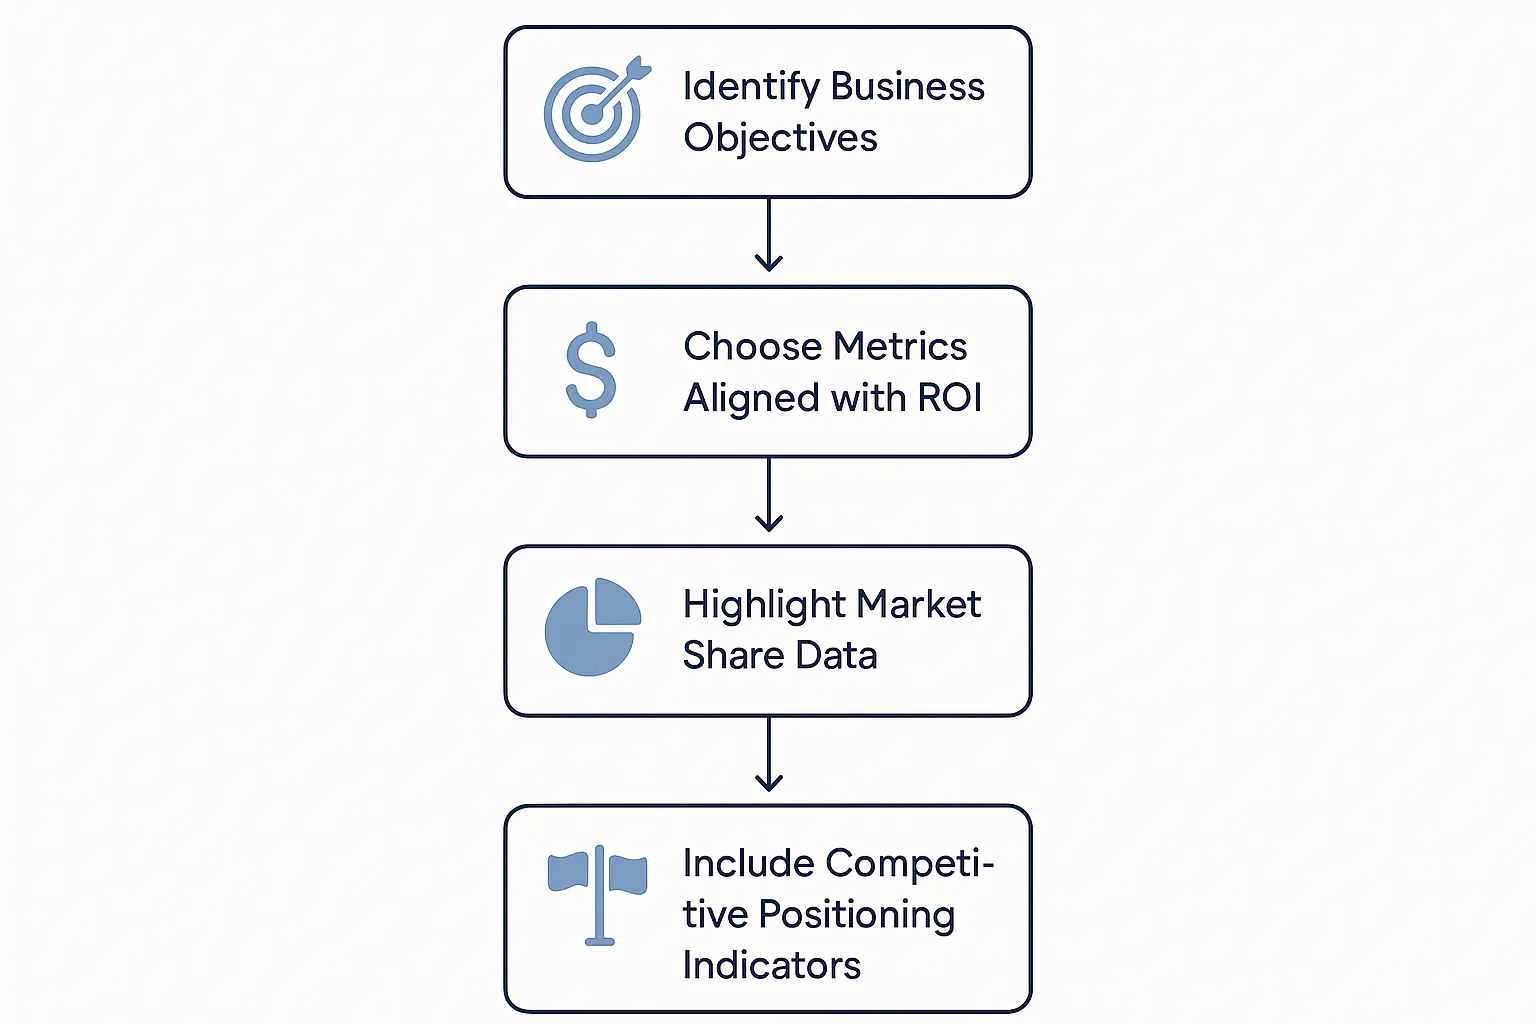
Building Your One-Page Executive SEO Dashboard
Your dashboard should be clean, visual, and tell a clear story. Think of it as an infographic, not a spreadsheet. Here are the essential components.
1. The Executive Summary (The 30-Second Read)
Start with three to four bullet points at the very top. This is for the executive who reads nothing else. It should concisely state:
- The Bottom Line: “Organic search generated $150,000 in attributed revenue this quarter, a 15% increase.”
- The Key Insight: “Our Share of Voice grew by 5%, primarily taking market share from Competitor X.”
- The Strategic Next Step: “Next quarter, we will focus on converting this new visibility into bottom-of-funnel leads.”
2. Performance Snapshot: Connecting SEO to Business Goals
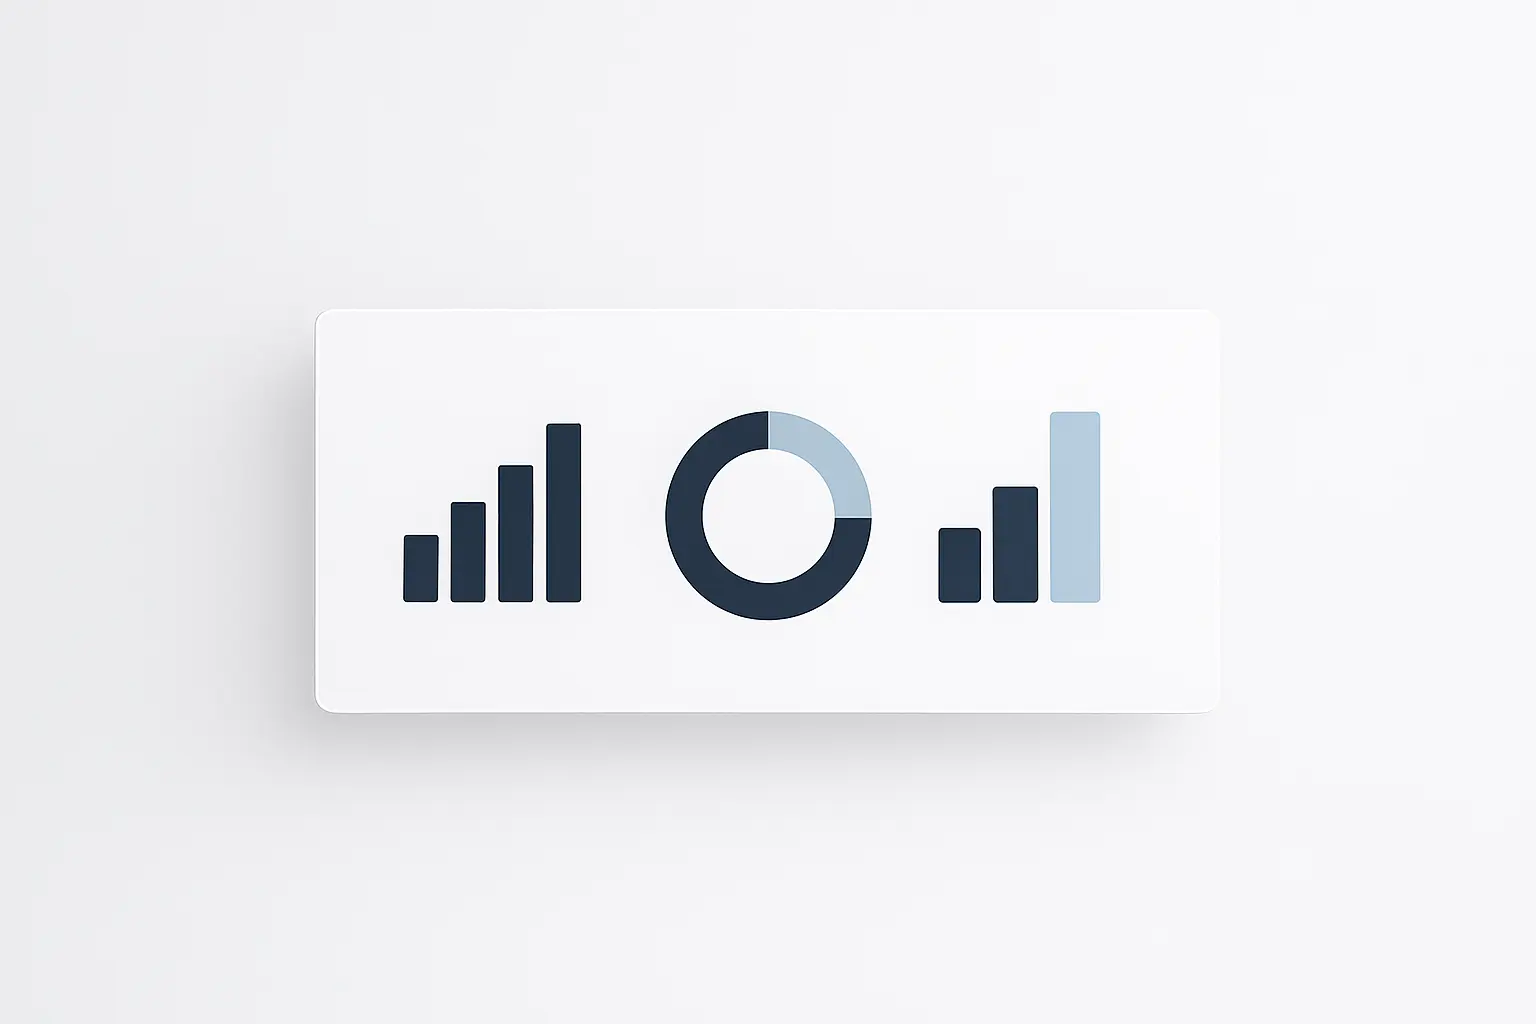
This section visualizes the direct impact of your SEO efforts on the business’s bottom line. Use simple charts or scorecards.
- Revenue from Organic Traffic: The ultimate metric. If you have e-commerce or goal tracking set up, this is your headline number.
- Organic-Sourced Leads/Conversions: For B2B or lead-gen businesses, this is the most critical metric. Show the trend over time (e.g., month-over-month or quarter-over-quarter).
- Organic Channel ROI / CPA: Compare the Cost Per Acquisition from organic search against paid channels. This is a powerful way to demonstrate SEO’s long-term value and efficiency.
3. Market Position: Where We Stand and Where We’re Going
This section shifts the focus from internal performance to the competitive landscape, demonstrating strategic value beyond just traffic generation.
- Share of Voice (SOV): Frame this as “digital shelf space.” It measures your visibility across a set of high-value keywords compared to your competitors. An increasing SOV is a powerful indicator of growing market authority. This is a core tenet of an effective omnichannel growth SEO strategy, as it reflects brand presence in the search landscape.
- Competitive Landscape: A simple bar chart showing your client’s SOV alongside their top two or three competitors. This instantly contextualizes performance and highlights opportunities or threats.

The Agency Advantage: Delivering C-Suite Insights at Scale
Creating a custom, high-impact dashboard like this for every client can seem daunting. Manually pulling data from a dozen sources and wrestling with spreadsheets isn’t scalable.
This is how modern agencies get their edge. By leveraging AI-powered SEO automation, teams can streamline data collection and visualization, freeing up strategists to focus on what humans do best: interpreting the data and crafting a compelling narrative.
The presentation is paramount. The report should look like it came directly from your agency, reinforcing your brand’s value and professionalism. Leading agencies rely on white-label SEO services to produce these polished, C-suite-ready deliverables consistently, ensuring every client communication strengthens their own brand.
Frequently Asked Questions About Executive SEO Reporting
How often should I send this report?
A monthly one-page dashboard is a good cadence to maintain momentum and keep SEO top-of-mind. Complement this with a more in-depth strategic review quarterly to discuss long-term trends and plan future initiatives.
Should I still track traditional SEO metrics like rankings and backlinks?
Absolutely. Those metrics are crucial diagnostic tools for your team. They help you understand why business outcomes are changing. Just remember: they belong in your internal analysis, not in the C-suite summary.
What tools can help create these dashboards?
Tools like Google Looker Studio, Databox, or even well-designed templates in Canva or PowerPoint can create visually appealing one-page reports. The key is to connect your data sources (like Google Analytics and Google Search Console) to automate the updates.
What if my client doesn’t have revenue tracking set up?
If direct revenue attribution isn’t possible, focus on the next best thing: high-value conversions. These could be demo requests, quote form submissions, or newsletter sign-ups. You can even work with the client to assign an estimated dollar value to each lead to create a clearer picture of ROI.
Conclusion: From Data Points to Decision-Making
Transforming your reporting is about more than just changing a document; it’s about elevating the conversation around SEO. By shifting the focus from technical activities to business outcomes, you reposition SEO from a line-item expense to a strategic driver of growth.
The one-page executive dashboard doesn’t just get read—it gets used. It provides the clarity and context leaders need to make informed decisions, approve bigger budgets, and see your agency as an indispensable partner in their success.