Ever presented a report to a client, proud of the stellar blog traffic you’ve generated, only to be met with a lukewarm, ‘That’s great, but how did it help us?’
You know the blog post did more. It fueled your social media calendar for a week, became the core of an email newsletter, and even armed the sales team with a valuable resource. But your reports don’t tell that story. They show siloed metrics: SEO traffic here, social engagement there, email clicks somewhere else.
This is the silo trap. It forces you to defend the value of each channel individually, completely missing the bigger, more powerful picture: the amplification effect. It’s what happens when your channels stop competing for credit and start working together, creating a result far greater than the sum of its parts.
The Problem with Siloed Reporting
Traditional marketing reports are built on a flawed premise. They treat each channel like its own island, with its own set of goals and KPIs. This model is a relic of a simpler time.
Today, the customer journey is anything but linear. A user might discover your client’s brand through a Google search, see a retargeting ad on LinkedIn, get an email, and finally convert after reading a G2 review. Which channel gets the credit?
Trying to assign 100% of the credit to a single touchpoint is like trying to credit a basketball team’s victory to a single player. It ignores the assists, the screens, and the defensive plays that made the final shot possible.
This isn’t just a feeling; it’s a fact. Research from Nielsen shows that integrated campaigns—those that use a consistent message across multiple channels—drive a 90% higher lift in brand awareness than single-channel campaigns. When your reporting fails to capture this synergy, you’re leaving the most compelling part of your value story untold.
Shifting from Multichannel to Omnichannel Thinking
Let’s clear up a common point of confusion. Multichannel means you’re using multiple channels to talk at your audience. Omnichannel means you’re using multiple channels to create a single, unified conversation with your audience.
It’s the difference between shouting from five different street corners and creating a seamless, guided tour through a city.
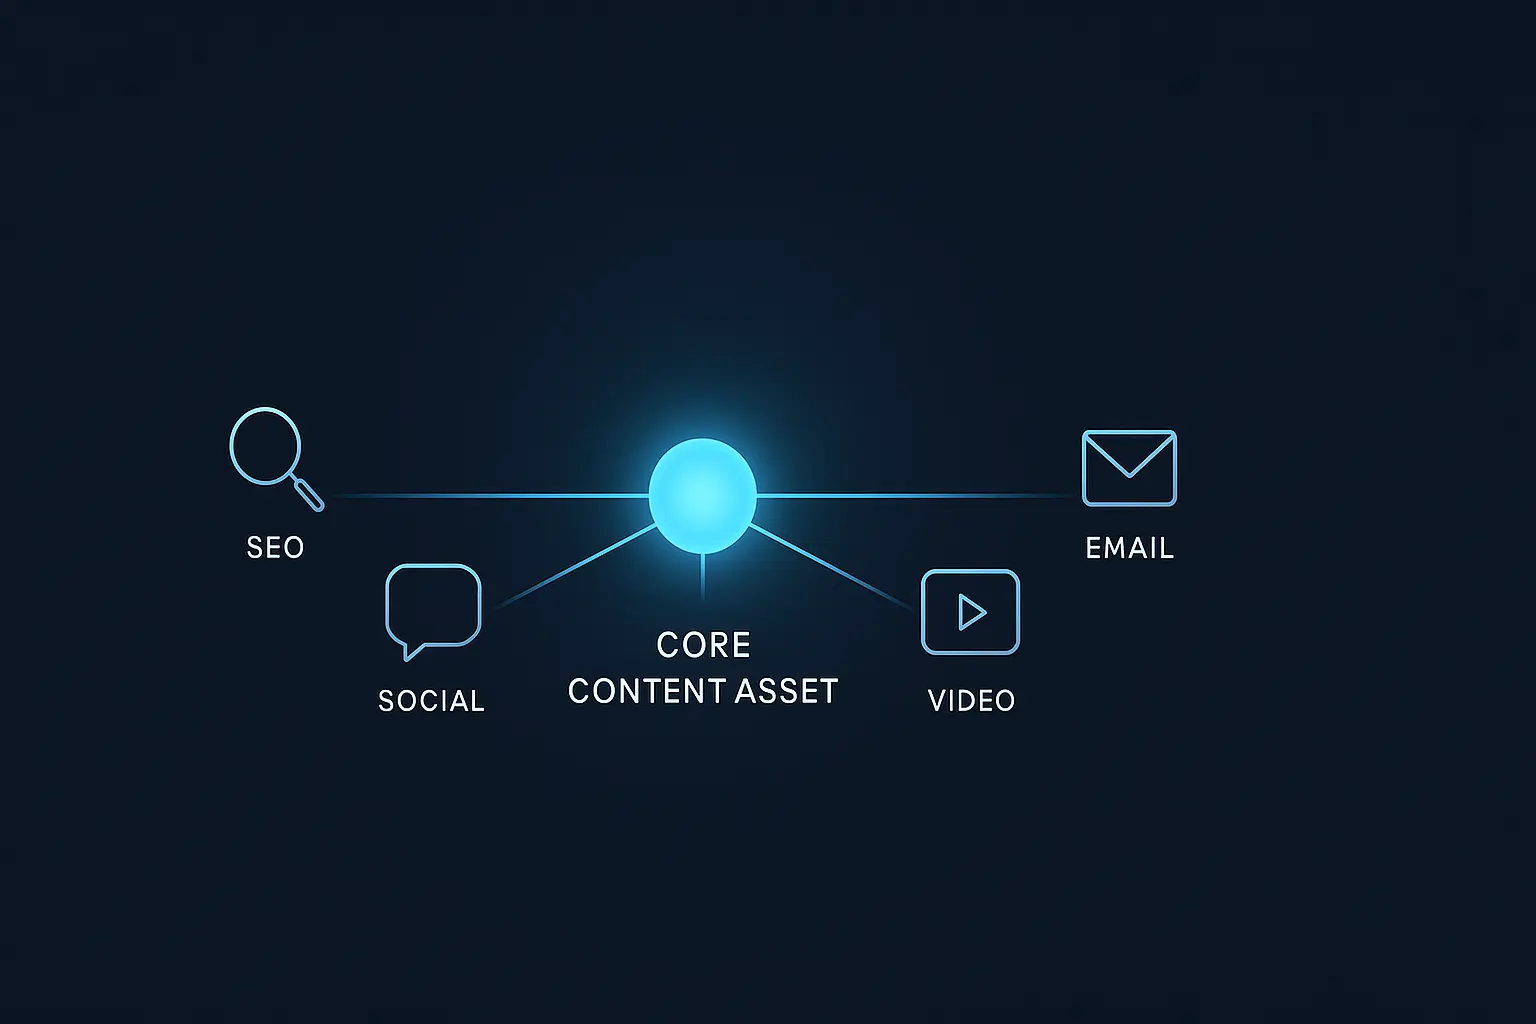
In an omnichannel strategy, a single piece of content becomes the central hub of a campaign. A deep-dive article on your blog doesn’t just exist to rank for keywords; it becomes:
- A script for a short-form video on TikTok and Reels.
- A series of thought-provoking questions for a LinkedIn poll.
- The foundation of an educational email nurture sequence.
- Data points for a visually engaging infographic.
This strategic integration is where agencies can truly shine, but only if they can measure its impact. Businesses that successfully adopt omnichannel strategies achieve 91% greater year-over-year customer retention rates compared to those that don’t. The reason is simple: the experience feels cohesive, helpful, and built around the customer’s needs, not the company’s org chart. For agencies looking to deliver exceptional results, offering scalable white-label SEO services that integrate into a broader content strategy is the first step toward achieving this unified vision for clients.
Measuring What Truly Matters: CAC and LTV
To prove the amplification effect, we need to move beyond vanity metrics like traffic, impressions, and likes. While these have their place, they don’t speak the language of the C-suite. The metrics that truly matter are Customer Acquisition Cost (CAC) and Lifetime Value (LTV).
- Customer Acquisition Cost (CAC): How much does it cost, in total, to acquire a new customer?
- Lifetime Value (LTV): How much revenue does the average customer generate for the business over their entire relationship?
The goal of any great marketing strategy is simple: decrease CAC while increasing LTV. The amplification effect does exactly this. By creating a cohesive journey, you build trust and familiarity more efficiently. The lead is warmer, the sales cycle is shorter, and the cost to acquire that customer goes down. At the same time, because the customer has been educated and nurtured through multiple touchpoints, they’re often a better fit, leading to higher retention and LTV.
The Amplification Effect Reporting Template
So, how do you actually report on this? It starts by reframing your report from a list of channel-specific data points to a campaign-centric narrative. Here’s a template to guide you.
Step 1: Define the Core Asset & Campaign Goal
Before you measure anything, define the centerpiece of your campaign—whether it’s a pillar blog post, a webinar, a downloadable ebook, or a research study—and its primary business goal. Is it to generate qualified leads for a new service, drive demo requests, or increase sales of a specific product?
Example:
- Core Asset: A comprehensive blog post, ‘The Ultimate Guide to B2B Cybersecurity.’
- Campaign Goal: Generate 50 marketing-qualified leads (MQLs) for the client’s new cybersecurity compliance service.
Step 2: Map the Amplification Channels
List every channel you used to promote and repurpose the core asset. Be exhaustive. This isn’t just about where you posted a link; it’s about how you used the asset’s core ideas.
- SEO: Optimized the blog post for relevant keywords.
- Paid Social (LinkedIn): Promoted a short video summary of the post to a targeted audience.
- Email Marketing: Sent the guide to a segmented newsletter list.
- Organic Social (Twitter/X): Created a thread of key takeaways.
- Sales Enablement: Packaged the guide as a PDF for the sales team to use in conversations.
Step 3: Track Connected KPIs, Not Isolated Metrics
Now, instead of creating separate tables for each channel, group your metrics around the campaign’s story.
Awareness & Reach:
- Total Impressions: (Sum of Organic Search Impressions + Paid Ad Impressions + Social Media Reach)
- Branded Search Lift: Did searches for the client’s brand name increase after the campaign launched? (Check Google Search Console).
Engagement & Nurturing:
- Blog Engagement: Time on Page, Scroll Depth.
- Cross-Channel Engagement Rate: (Likes + Comments + Shares + Saves) / Total Followers.
- Email Click-Through Rate: On the campaign-specific email.
Conversion & Business Impact:
- Assisted Conversions: How many times did this blog post appear in the conversion path for users who eventually became MQLs? (Check Google Analytics 4).
- Total MQLs Generated: From all channels combined.
Step 4: Calculate Blended CAC
This is where the unified picture comes into focus. Instead of calculating a separate CAC for SEO and a separate CAC for Paid Social, you calculate one blended CAC for the entire campaign.
Formula: (Cost of Content Creation + Total Ad Spend + Tool Costs) / Total New Customers Acquired from Campaign
This gives you a true, holistic view of what it cost to acquire a customer using this integrated strategy. You’ll often find this blended CAC is significantly lower than the CAC of any single channel operating in a vacuum. This is a critical metric for any agency considering SEO outsourcing for agencies, as a partner who understands this model can deliver more efficient, growth-focused results.
Step 5: Connect to the Bigger Picture
Finally, zoom out. How did this campaign contribute to the client’s overarching goals?
- Did the leads generated have a shorter sales cycle?
- Did this campaign help the sales team close a major deal?
- Are the customers acquired through this campaign on track for a higher LTV?
This qualitative data, combined with your quantitative metrics, tells a powerful story of strategic growth.
A Quick Example in Action
Imagine your agency launches ‘The Ultimate Guide to B2B Cybersecurity’ for a client.
- Siloed Report: ‘The blog post got 5,000 organic visits and the LinkedIn ad got a 2% CTR.’ (Client: ‘So what?’)
- Amplification Report: ‘Our integrated cybersecurity campaign reached 150,000 targeted professionals. By using the blog post to fuel our LinkedIn and email efforts, we generated 65 MQLs at a blended CAC of $150, which is 30% lower than the company’s average. Furthermore, the sales team reported that these leads were better educated and closed 15% faster.’ (Client: ‘Wow, let’s do more of that!’)
This shift in reporting elevates your agency from a service provider to a strategic agency SEO partner. You’re no longer just delivering tasks; you’re architecting growth.
Frequently Asked Questions (FAQ)
What’s the difference between multichannel and omnichannel?
Multichannel is about being present on multiple platforms. Omnichannel is about connecting those platforms to create a single, seamless customer experience. Think of it this way: multichannel is having a store, a website, and an app. Omnichannel is when you can buy online and return in-store without any friction.
What tools do I need for omnichannel reporting?
At a minimum, you’ll need Google Analytics 4 (GA4) for its focus on event-based tracking and cross-channel attribution. A good CRM (like HubSpot or Salesforce) is essential for connecting marketing activities to sales outcomes. Finally, social media scheduling and analytics tools can help you consolidate engagement data.
How long does it take to see the amplification effect?
The initial engagement (likes, shares, clicks) can be seen within days. However, the true business impact—like a lower CAC and influence on LTV—takes longer to measure. You should plan to measure and report on these campaigns quarterly to see the trends develop.
Can I apply this model to a small client with a limited budget?
Absolutely. In fact, it’s even more critical for small budgets. An omnichannel approach ensures that every dollar spent is maximized. A single blog post can fuel a month’s worth of content across all channels, making a small budget go much further than if you were creating separate, disconnected assets for each platform.
From Scattered Data to a Unified Growth Narrative
Measuring the amplification effect is about more than just a new reporting template. It’s a mindset shift. It’s about seeing the customer journey holistically and understanding that your value as an agency lies not in executing isolated tasks, but in orchestrating a symphony of interconnected marketing efforts.
When you learn to measure and communicate this interconnected value, you stop selling services and start demonstrating a strategic partnership. You give clients a clear, compelling narrative of how your work is not just a cost center, but a direct and efficient driver of their growth.