The Unified Performance Dashboard: Your Template for Combining Paid & Organic KPIs in Looker Studio
Ever had that client meeting where you present a beautiful report on soaring organic traffic, only for the client to ask, “That’s great, but why did my Google Ads cost-per-conversion go up 15% last month?”
You pull up a separate Ads report and try to connect the dots on the fly, talking about market trends, competitor bidding, and keyword overlap. But the story feels disjointed because your data is. The paid search team and the SEO team are telling two different stories, even though they’re reading from the same book.
If this sounds familiar, you’re not alone. Most agencies report on paid and organic search in separate documents, leaving clients to stitch together the big picture themselves. But what if you could show them the whole story in a single glance?
According to research from BrightEdge, paid and organic search drive over 70% of all traffic for most websites. When your two most powerful channels are treated as separate entities, you’re not just creating confusing reports—you’re missing out on critical strategic insights.
This guide will show you how to break down those silos. We’ll walk you through a template and a step-by-step process for creating a Unified Search Performance Dashboard in Looker Studio that combines data from Google Ads, Google Search Console, and Google Analytics 4 into a single, powerful view.
Why Siloed Reports Are Silently Sabotaging Your Strategy
Reporting on paid and organic search separately is standard practice—it’s how the platforms are built, and it’s how most of us learned to do it. But this separation creates blind spots that can lead to inefficient spending, missed opportunities, and a fragmented understanding of your total search footprint.
Think about it:
-
The Cannibalization Question: Are your paid ads stealing clicks from your number one organic listings? Without a unified view, it’s just a guess.
-
The Halo Effect: Is a top-of-funnel paid campaign creating more branded organic searches? Separate reports will never show this direct correlation.
-
The Budget Allocation Blind Spot: Are you spending heavily to acquire paid traffic for keywords where you already dominate organically? You might be wasting money on traffic you would have gotten for free.
According to Gartner, integrated campaigns running across four or more channels can outperform single or dual-channel campaigns by up to 300%. While this stat refers to broader marketing, the principle holds true for search. When paid and organic strategies work in harmony, their combined impact is exponential. An omnichannel growth SEO approach requires data that reflects this integration.
Your Agency’s New Superpower: The Unified Dashboard
A unified dashboard isn’t just a prettier report; it’s a strategic tool that transforms your client conversations from reporting on metrics to advising on growth.
Why is this so powerful? Research from Google found that businesses using data-driven marketing are six times more likely to be profitable year-over-year. By providing a single source of truth for all search activity, you empower your clients (and your own team) to make smarter, data-driven decisions.
This is also a massive competitive advantage. A study by Score.org revealed that less than 30% of small businesses use website analytics. Most clients are flying blind. When your agency presents a holistic, unified view of their most important traffic channels, you instantly elevate your value from a service provider to an indispensable strategic partner.
Building Your Dashboard: A Step-by-Step Guide
Let’s get practical. We’ll use Looker Studio (formerly Google Data Studio) because it’s free, powerful, and integrates seamlessly with Google’s marketing platforms.
Step 1: The Blueprint — Connecting Your Data
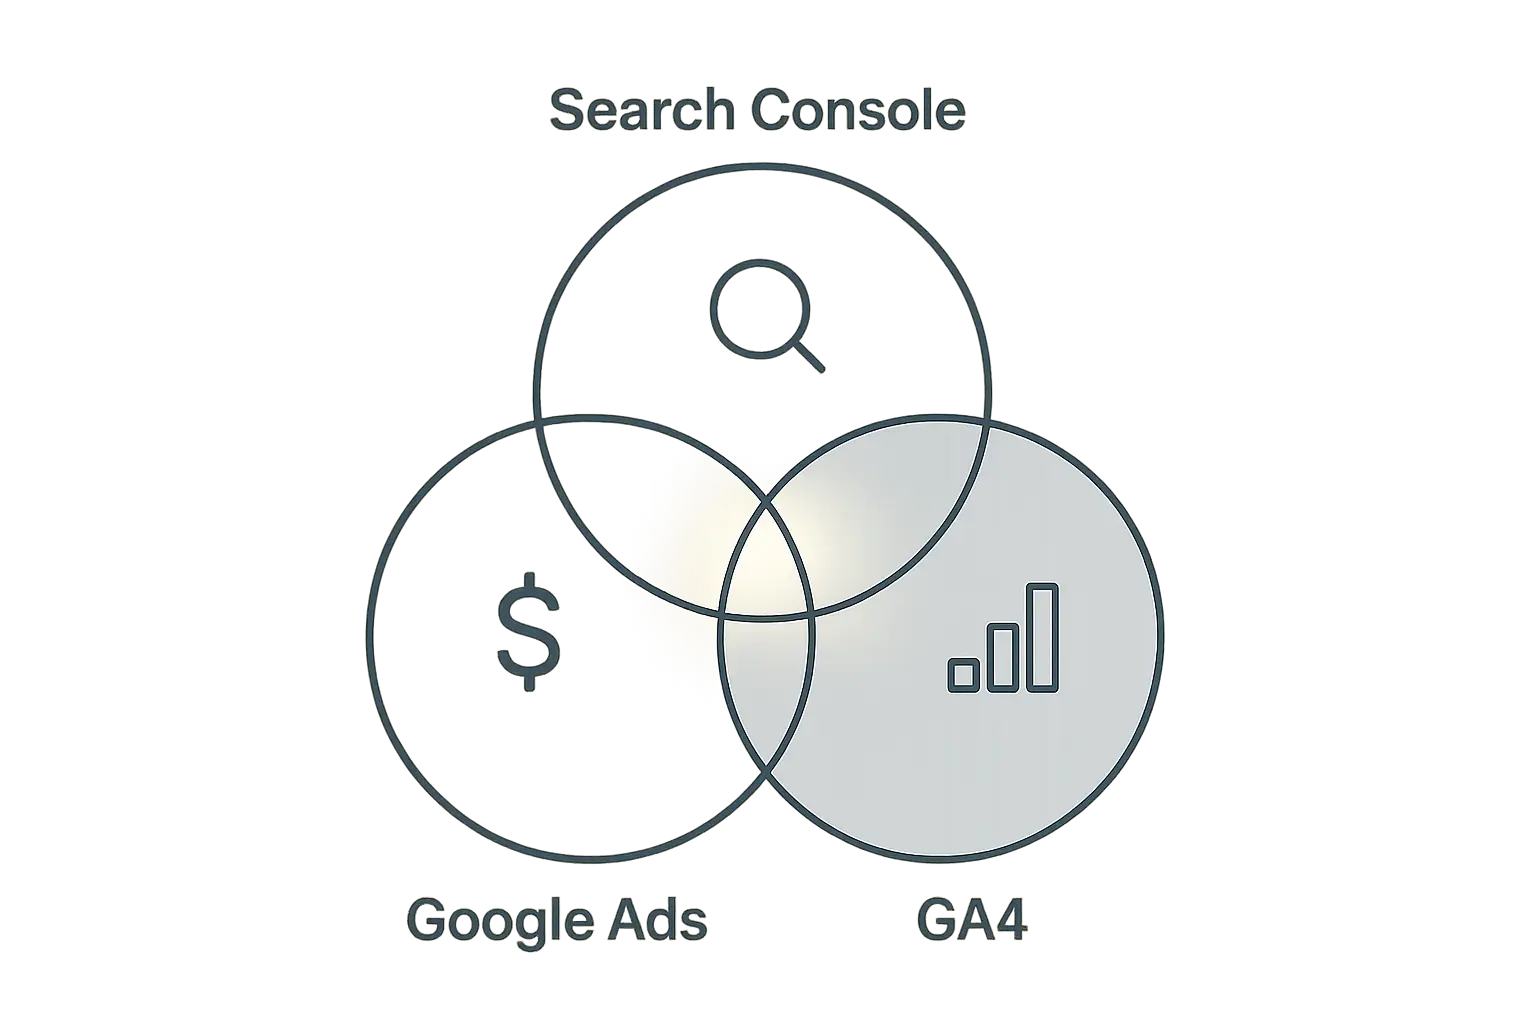
First, you need to pull data from three sources into Looker Studio:
- Google Ads: For all your paid search metrics (Cost, CPC, Conversions).
- Google Search Console (GSC): For your organic performance data (Clicks, Impressions, Average Position).
- Google Analytics 4 (GA4): For website behavior and conversion data that ties both channels together.
Think of Looker Studio as the meeting room and these data sources as the key stakeholders you’re inviting. You simply add each one as a “Data Source” within your Looker Studio report.
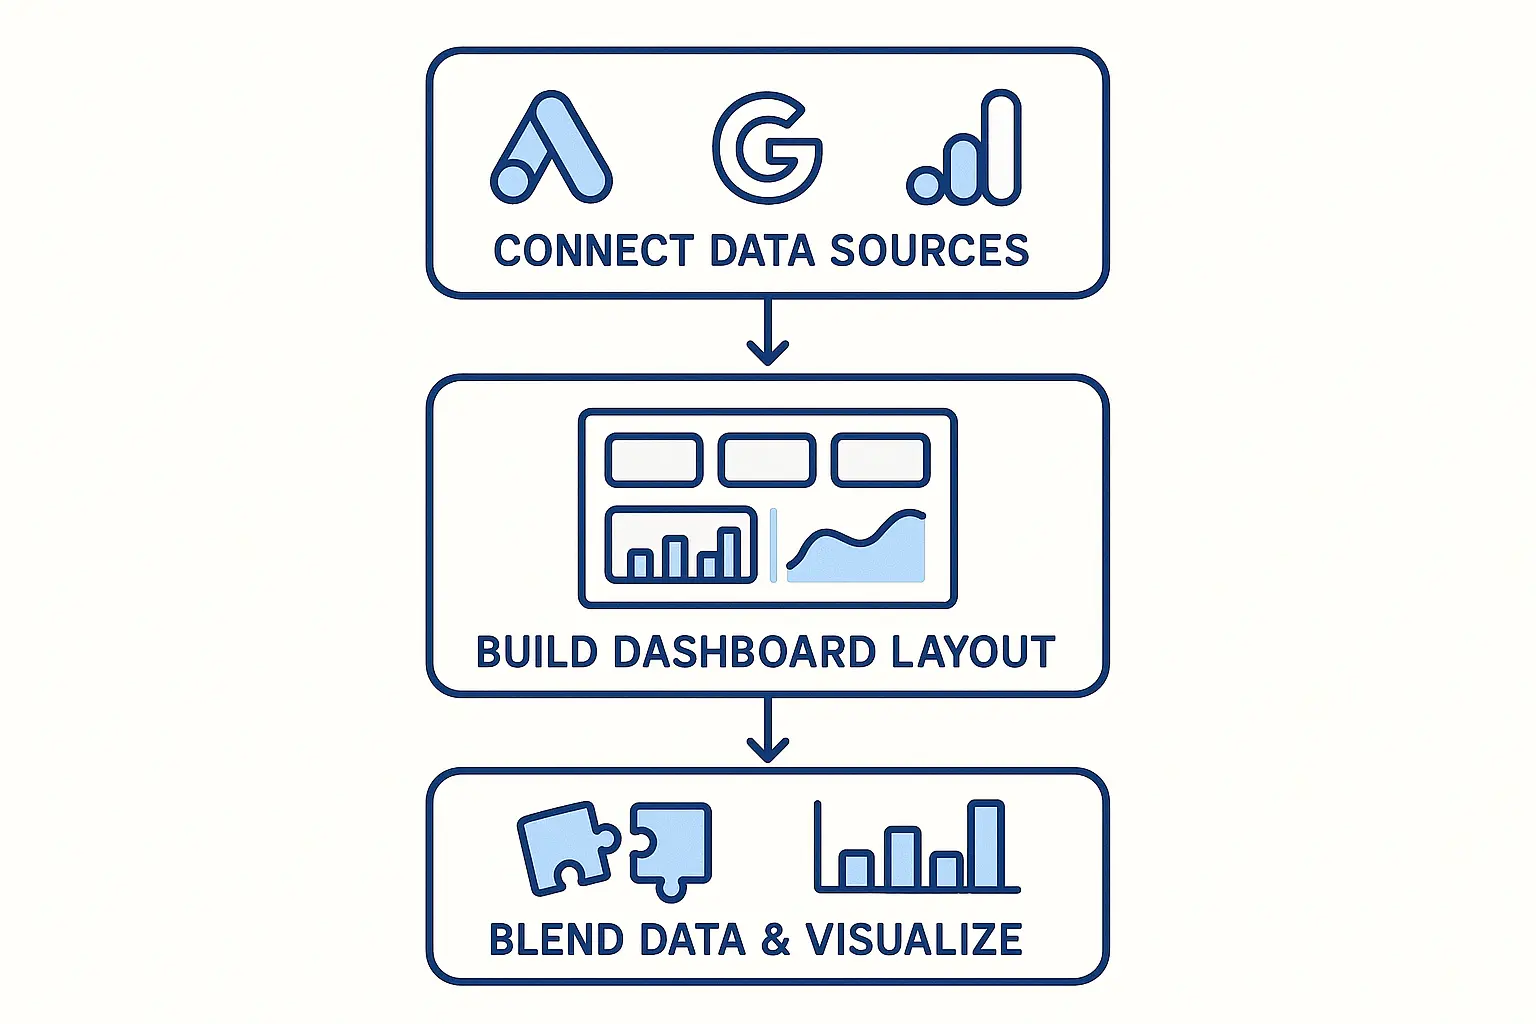
Step 2: Defining the “What” — Key Metrics to Track
A great dashboard tells a clear story. We’ll structure ours to show channel-specific performance first, then the combined, blended view.
Paid Search KPIs (from Google Ads):
- Cost
- Impressions
- Clicks
- CTR (Click-Through Rate)
- CPC (Cost Per Click)
- Conversions
Organic Search KPIs (from Search Console):
- Impressions
- Clicks
- CTR (Click-Through Rate)
- Average Position
Blended Performance KPIs (The Magic):
This is where you’ll create custom fields to combine paid and organic metrics, giving you the “total search” view that clients love.
Create these simple blended metrics:
- Total Search Impressions: GSC Impressions + Google Ads Impressions
- Total Search Clicks: GSC Clicks + Google Ads Clicks
- Blended CTR: Total Search Clicks / Total Search Impressions
- Total Site Conversions (from GA4): To see the final business impact.
Step 3: From Data to Insights — Telling the Story
Now that your data is in one place, you can spot insights that were previously invisible.
-
Insight Example 1: You notice Total Search Clicks are stable, but the ratio is shifting from paid to organic for a key commercial term. This means your SEO efforts are working, and you can consider reallocating that paid budget to a new, exploratory keyword.
-
Insight Example 2: You launch a new paid campaign and see a spike in branded organic searches two weeks later. You can now directly show the client how paid search is building their brand equity and fueling other channels.
-
Insight Example 3: A keyword has a low organic CTR but a high paid CTR. This could mean your organic meta description isn’t as compelling as your ad copy. Time for an SEO tweak!
The Challenge of Scale: Can You Do This for 20 Clients?
While building this dashboard for one client is an incredible value-add, creating and maintaining it for every client can quickly become a full-time job, pulling your team away from strategic work. The manual effort of checking connections, updating fields, and customizing reports for each client simply doesn’t scale.
This is where agency operations come into focus. As you grow, you’ll find that leveraging AI-powered SEO automation for tasks like reporting becomes essential for maintaining profitability and service quality. For agencies looking to deliver this level of sophisticated reporting without building the internal infrastructure from scratch, partnering with specialized white-label SEO services can be a powerful way to scale expertise instantly.
Frequently Asked Questions (FAQ)
What is Looker Studio?
Looker Studio, which you may know by its old name, Google Data Studio, is a free tool that turns your data into informative, easy-to-read, and easy-to-share dashboards and reports.
Are the connectors for Google Ads, GSC, and GA4 free?
Yes! The native connectors built by Google are completely free to use.
Can I brand this dashboard with my agency’s logo?
Absolutely. Looker Studio is fully customizable. You can add your agency’s logo, change the color scheme to match your brand, and tailor the entire report to look like it was developed in-house.
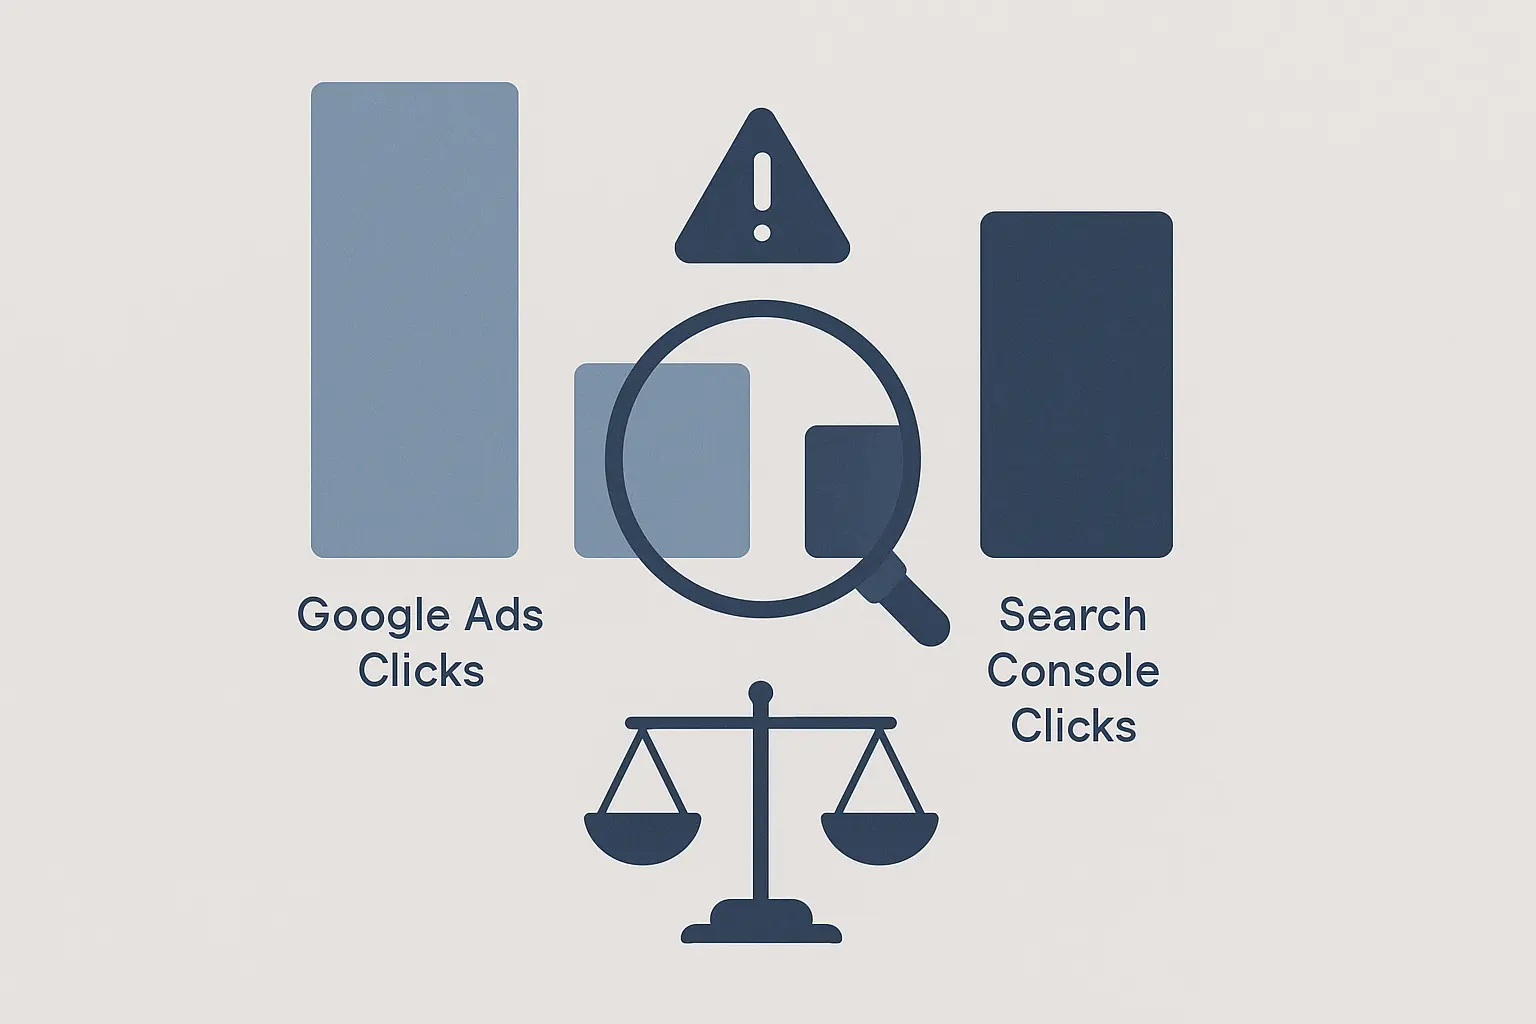
What’s the difference between a “click” in Search Console and a “session” in GA4?
A GSC “click” happens when a user clicks your link in the search results. A GA4 “session” starts when that user lands on your site. One user could click, leave, and then come back directly later, resulting in one click but two sessions. They measure different things, which is why it’s important to have both in your dashboard.
What if my client only does SEO and not paid search?
The template is still valuable! You can simply hide or remove the Google Ads components and use the GSC and GA4 integration to create a more robust organic performance report than either platform could provide on its own.
Beyond the Dashboard: Your Next Step
A unified dashboard is the first step. It gives you the “what.” The next, more important step is to build the “so what?”—the strategic story that drives decisions and growth.
This dashboard is your foundation for deeper, more meaningful conversations with clients. It’s how you move from being the “SEO agency” or the “PPC agency” to becoming their indispensable partner for digital growth. By showing the complete picture, you demonstrate a level of strategic oversight that sets you apart and makes your agency irreplaceable.